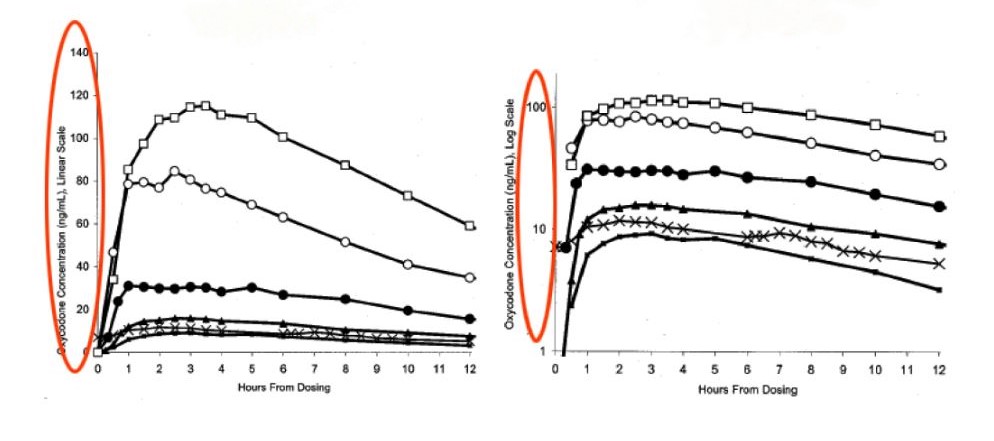
Pain Relief Plots
In the mid 1990s, Purdue Pharma presented a chart indicating the prolonged drug effectiveness of OxyContin, but the graph used a logarithmic scale on the Y-axis. When converted to a linear scale, it revealed a rapid decline in drug concentration shortly after administration, contradicting the initial impression of sustained relief. Purdue Pharma used this graph to suggest that OxyContin was non-addictive as the long duration of the drug in the blood over time limits withdrawal symptoms.
