What is the opportunity for companies at the Bottom of the Pyramid?
In 2002, C.K. Prahalad and Stuart Hart wrote their seminal article “The Fortune at the Bottom of the Pyramid1” that preceded the publication of Prahalad’s book by the same name. The article highlighted that the poor warrant the attention not only of the State or NGOs who seek to provide for their needs, but also of commercial entities, who can serve them as worthy customers.
The concept of the Bottom of the Pyramid is particularly pertinent in countries such as South Africa that have a large poor and underserved market that has historically been excluded from mainstream economic activity.
But what is the Bottom of the Pyramid and just how big is it in South Africa?
What is the Bottom of the Pyramid?
As the term suggests, the “bottom of the pyramid” is used to describe the large group of consumers living at the bottom of the global economic or wealth pyramid.
In 2002, Prahalad estimated that there were approximately four billion people globally living on less than $4 per day. His income per capita measure is a fairly standard basis for measuring poverty by global entities such as the World Bank and the UNDP, although the cut off of $4 per day that Prahalad used is controversial. More typically, those who live on less than $2 per day would be considered poor. Critics claimed that the opportunity he saw was in fact a mirage created precisely because he had included more ‘middle class’ consumers in his definition.
Nevertheless, a per capita measure is a useful one. In contrast to household income it explicitly accounts for household size; a household comprising two people that earns R2 000 per month is demonstrably better off than a household comprising four people with the same income. But the measure still suffers from two weaknesses:
- The first is it assumes that it is possible to estimate household income with a sufficiently high degree of accuracy. This is often not the case for poor households who often have multiple and highly variable income sources and who might generate some income in kind.
- Secondly, it assumes that the household is a stable unit comprising a nuclear family that sticks together through thick and thin. In reality, nuclear families are relatively uncommon among the poor.
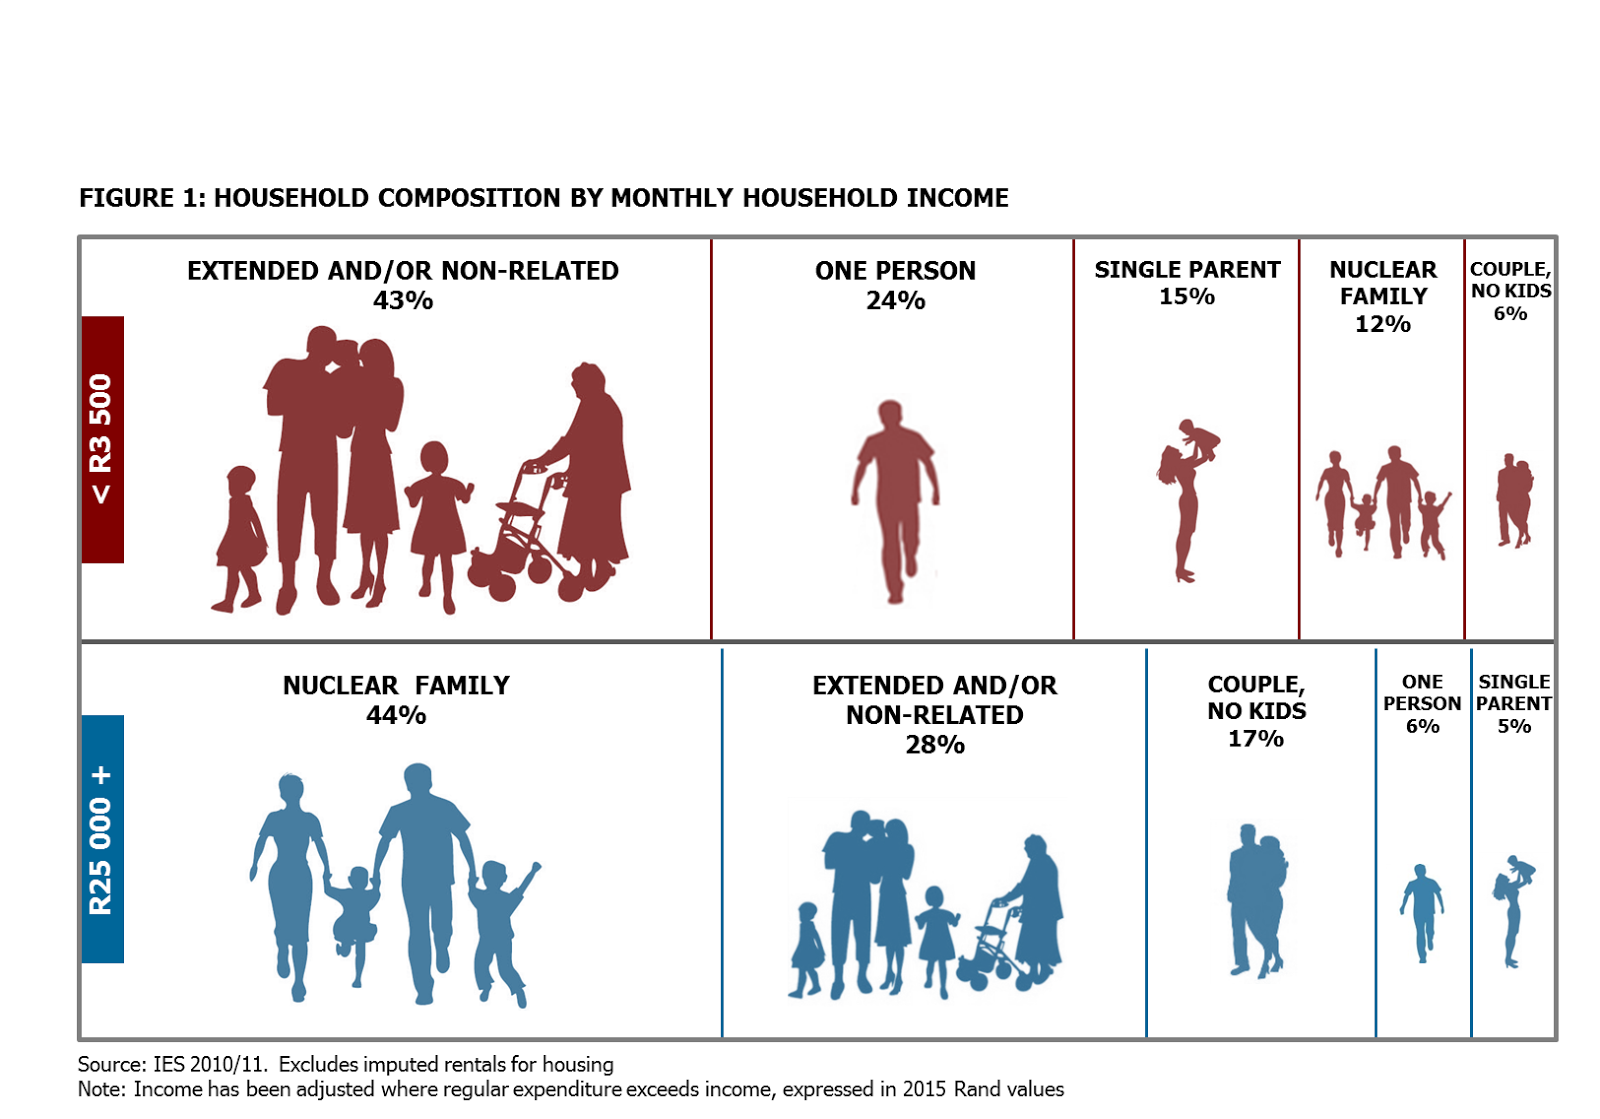
As per the chart below, in South Africa, nuclear families account for just 12% of households who earn less than R3 500 per month, compared to 44% in higher income segments [see figure 1].
Household formation is often in itself a response to poverty; spouses may live apart in response to the availability of economic opportunity or children and grandchildren may live with an old age pensioner precisely because she or he earns a state pension.

How big is the Bottom of the Pyramid in South Africa?
This is not a simple question to answer. Assuming we use Prahalad’s threshold of $4 per capita income we would need to translate that into a meaningful Rand equivalent. Exchange rates have fluctuated fairly significantly, reaching a high of R16.89 on 20 January 2016, and recovering to R13.27 on 16 August 2016.
Using these rates, Prahalad’s cut off would amount to just under R8 000 per month for a family of five. Clearly we need to adjust for purchasing power. Doing this gets us a rate closer to between R5.52 and R5.85 to the US Dollar, according to both World Bank, and the Economist’s Big Mac Index respectively. The corresponding Rand cut off would therefore lie close to R20 per person per day or R3 000 per month for a family of five.
How low can you go?
Perhaps the question is less about how big the market is at the Bottom of the Pyramid, and more about how low you can go.
Arguably, for companies that have traditionally focused on higher income suburban markets it might be optimal to take an incremental approach; target consumers who have some discretionary spend but who are most certainly still vulnerable and visibly under-served.
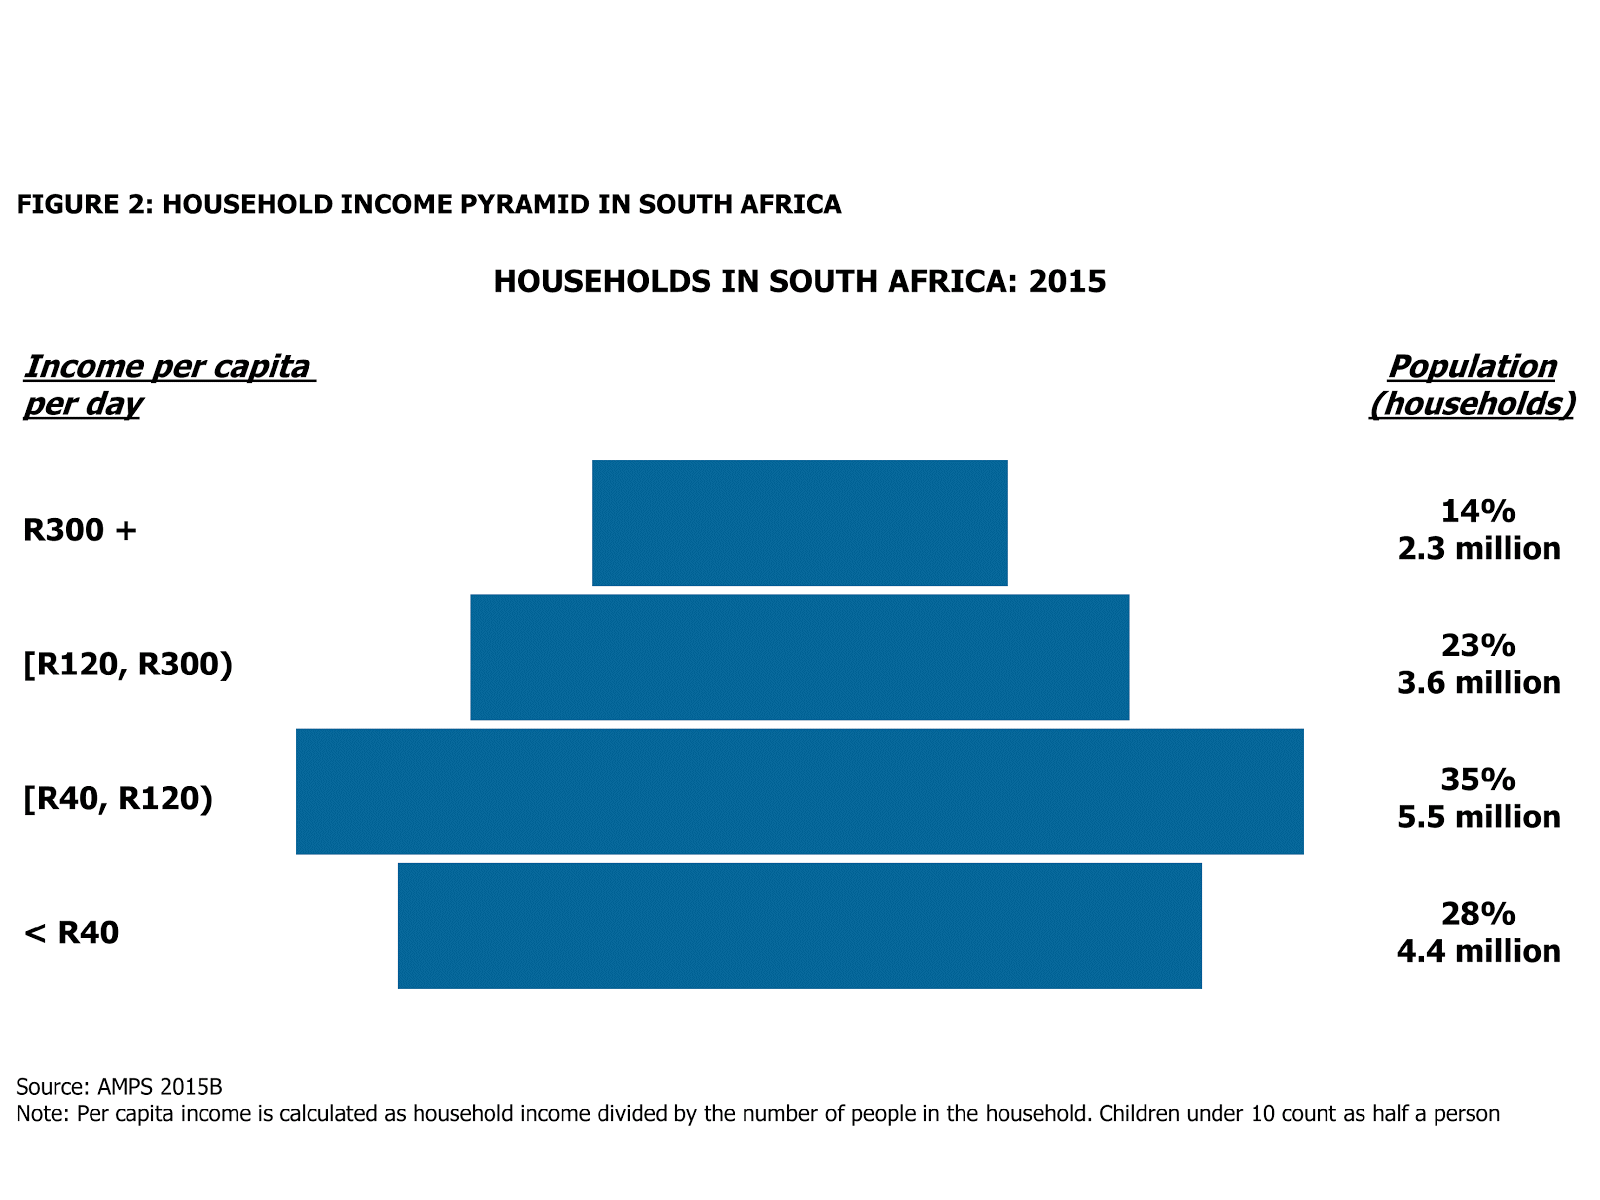
Using a cut off of R40 per capita income for instance would give us a market of roughly 28% of the 15.7 million households in South Africa in the Bottom of the Pyramid. This equates to 19.6 million individuals living in 4.4 million households according to the latest AMPS data [see figure 2].

What is the opportunity at the Bottom of the Pyramid in South Africa?
According to the relatively old, but still most recent Stats SA Income and Expenditure survey from 2010/2011, South African households earning less than R40 per person per day generate roughly 9% of total disposable income (or R166 billion in 2015).
While a large proportion of this disposable income is likely be spent on the essentials such as food, transport and electricity, these households clearly have discretionary spend that they are willing to spend on their preferred brands which are often not the cheapest in the category.
However, it is not trivial to serve this market, particularly when the consumers who purchase and use products and services, and the decision-makers who design them, and develop the channels to market and sell them can be worlds apart.
While this challenge may diminish as companies transform it remains critical for companies and brands to get on the ground and learn from their customers.
While this may seem like significant challenge requiring an enormous research effort, it might be simpler than you think. The most powerful insights into this market don’t come from complicated big data analytics. They require nothing more than respectful conversations and a genuine interest in the customer’s life. Just ask Parmalat how they developed a multi-million Rand business by selling their individually wrapped processed cheese slices in Kotas2 and Vetkoeks in townships across South Africa. Here’s a hint; it wasn’t by sitting in their offices.
Six tips for companies looking to serve the Bottom of the Pyramid in South Africa
- The Bottom of the Pyramid in South Africa comprises not only those who are poor, but those who are under-served. It is probably bigger than you expect.
- Pay attention to housing. Improved access to formal housing in South Africa will directly impact and shape our low-income consumers spending priorities (think more expenditure).
- Low-income does not mean low-price. Think high-value, high-trust.
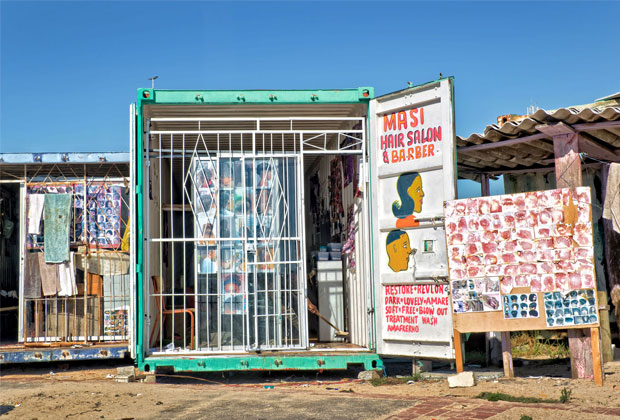
- Your biggest competitor is the informal market. It is definitely bigger than you think it is. Find out what value the informal providers are delivering to their customers and how you can replicate that value in your own strategy.
- Trust is built through consistent, positive customer experiences. Build testing into your marketing and promotional strategy, and then make sure your product and service works like you say it does.
- Pay very close attention to customer service and channels for recourse when things go wrong. When your product or service doesn’t work like you say it does, make sure your customers are able to get quick, efficient and useful help.
For more in-depth analysis and insights, view our 2016 research report on The Realities at the Bottom of the Pyramid.
Footnotes
1. The Fortune at the Bottom of the Pyramid by C.K. Prahalad and Stuart L. Hart, Strategy + business, Issue 26, 2002
2. Kota is a quarter loaf of bread that is hollowed out and topped with French fries, optional sauce, choice of meat, a fried egg and finished with a Parmalat cheese slice

Paseka Tladi
Portia Mokotso
Reut Agasi