Loyalty programme case study: Are you changing customer behaviour?
What will you learn from this case study?
One of the primary objectives of any loyalty programme is to change customer behaviour. Quantifying the behaviour change due to a programme is therefore critically important. There are different methodologies that can be used to measure behaviour change, depending on the type and quantity of data available.
This case study describes one of the behaviour change methodologies we – Eighty20 – utilised to help a large retailer.
The problem and proposed solution
A large retail client wanted to quantify the impact of their loyalty programme on in-store sales. Specifically, they wanted to quantify the additional revenue they could attribute to their programme. To do this, we used an advanced statistical technique: genetic matching.
What is genetic matching?
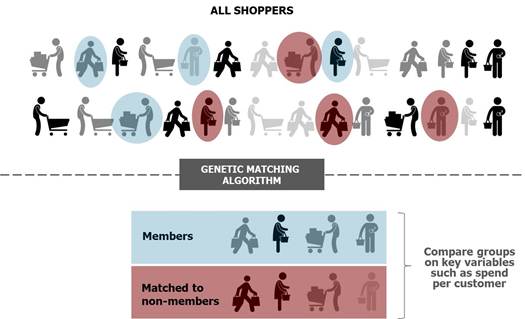
In the context of a retail loyalty programme (genetic) matching is used to create two groups of shoppers that are very similar in terms of their demographic profile and shopping behaviour.
In one group all shoppers are members of the loyalty programme (members) and in the other group no shoppers are part of the programme (non-members).
A matching algorithm, such as genetic matching, allows the member group and the non-member group to be compared on key variables, such as spend per customer. Differences observed between the two groups can be attributed to the loyalty programme as it is the only difference between the two groups of shoppers.

The process
In order to conduct the matching, we worked through five key steps as illustrated below:

Step 1: Access raw transaction data
We worked closely with the client to access the programme’s raw transaction data over four years. This data contained records for over 10 million customers with over one billion basket items.
Step 2: Collate transaction data into a customer view
The second step involved transforming the transactional data into a single customer view. This allowed us to see total spend per month for each individual customer as well as other metrics which described their demographics and shopping behaviour.
Step 3: Identify key variables to match customers on
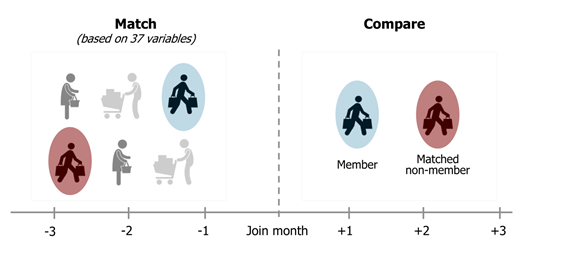
Using a multiple factor analysis the original dataset with 129 variables per customer was condensed to a dataset with only 37 variables that captured the most important differences between customers.
These variables were used by the matching algorithm to find a “twin” (matching non-member customer) for each member customer.
Examples of key variables obtained from the factor analysis included:
- How much does the customer buy?
- What does the customer’s basket look like?
- Does the customer spend more in the morning or the evening?
- Does the customer shop more during the week or on the weekend?
- Does the customer shop differently from one month to the next?
Step 4: Genetic matching algorithm
Matching was done based on three months of behaviour prior to the programme join date. To do this we used the 37 variables identified in the factor analysis to describe the behaviour of each member customer for the three months prior to joining the programme. After this the genetic matching algorithm was applied to find the non-member customer that matched that description best.

Step five: Compare spend between members and non-members
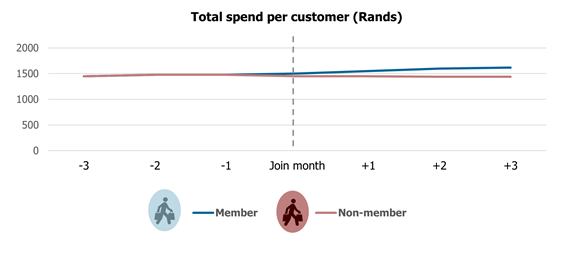
The final step in the process involved a comparison of the total spend of members and their “twins” (matched non-members) for the months after joining the programme. Other key metrics compared in the final analysis included frequency of visits to the retailer and spend per visit.

Did the rewards programme change customer behaviour?
Our analysis revealed that programme members were spending more in-store than non-members but only on certain categories.
Most importantly, we were able to quantify that increase in spend by programme members.
From this, our client was able to understand their programme’s performance and quantify the impact of the programme across different product categories.
The bottom line
Our analysis provided the client with robust, data-driven insights they could use to easily understand in quantifiable terms the value their programme had added to their bottom line.
