A Complete View of the South African Consumer: Part 2
This blog is the second in a series on how we built a comprehensive South African consumer dataset and segmentation. Read Part 1 on how we merged numerous datasets.
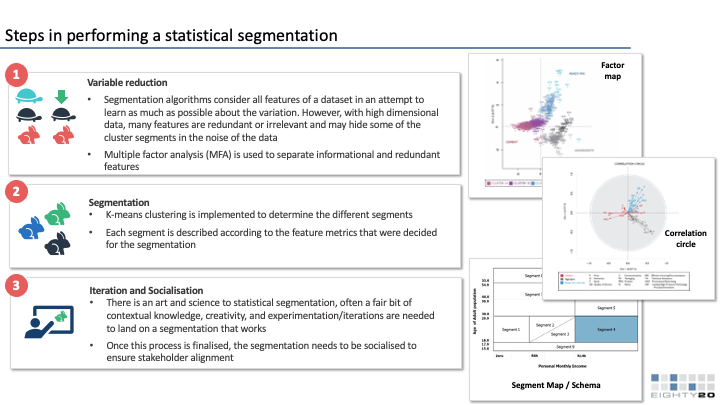
After resolving issues to improve the reliability of our combined dataset, we created segments and subsegments to describe the South African consumer. We first determined the key categories that we wanted to differentiate the population on, including credit behaviour, retail behaviour, media consumption, and life stage. Within each of these categories, we determined a few of the most important statistics (‘input variables”)for measuring people’s behaviour within each of these categories. Some of these statistics required feature engineering or imputing new summary statistics, such as brand affluence, enabling us to combine some of the more than 3,000 statistics and guide the segmentation appropriately.
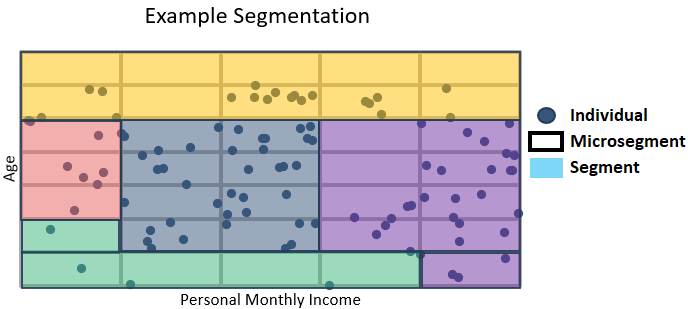
We then ran a k-means clustering algorithm using these input variables as inputs for each microsegment to guide our decision-making on which microsegments would fall into which segments. One key difference of our clustering technique to more common clustering is that the inputs we used were not individuals, but rather the microsegments themselves, as indicated by the example graphic below.
Each input variable was assigned a weight based on the relative importance we placed on the category of behaviour they represented. We also weighted the microsegments themselves based on a combination of the population they represented, and their purchasing power based on income. This ensured that the sections of the population most relevant to users of the segmentation were accurately clustered and did not get crowded out by other less relevant microsegments.
This process also helped us validate the methods we had used to construct and improve our combined dataset, as we could compare our expectations based on experience against the results of our clustering. We ran multiple iterations of the clustering, testing the effect of various changes to the process, before settling on the segmentation showcased here.
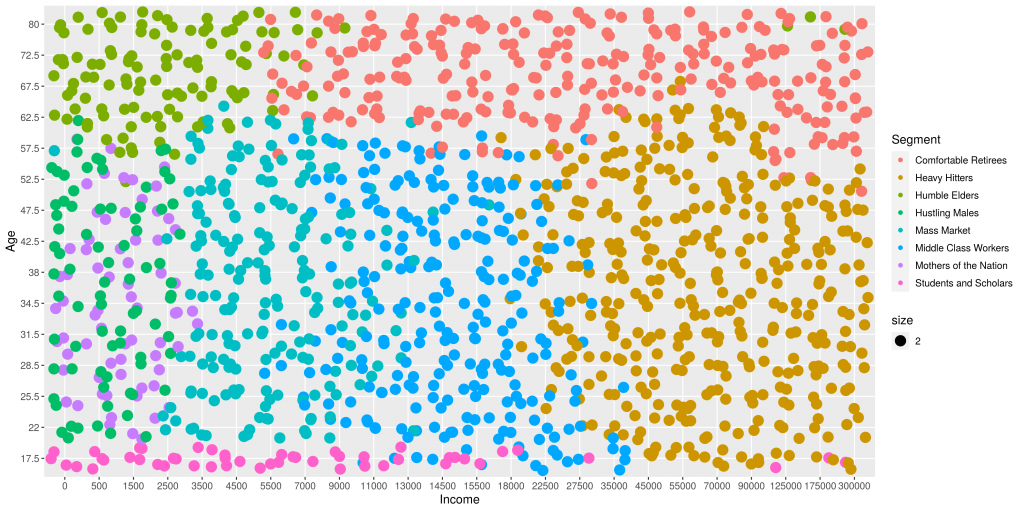
The scatter plot above maps individuals by income and age. In this view the segment boundaries are clearly observable, but it also highlights areas where further work is required. For instance, the few young people that are very high earners, or the few males in the segment we call ‘Mothers of the Nation’. These and other anomalies were addressed in future iterations of the combined dataset and segmentation.
The Eighty20 National Segmentation (ENS) Segments
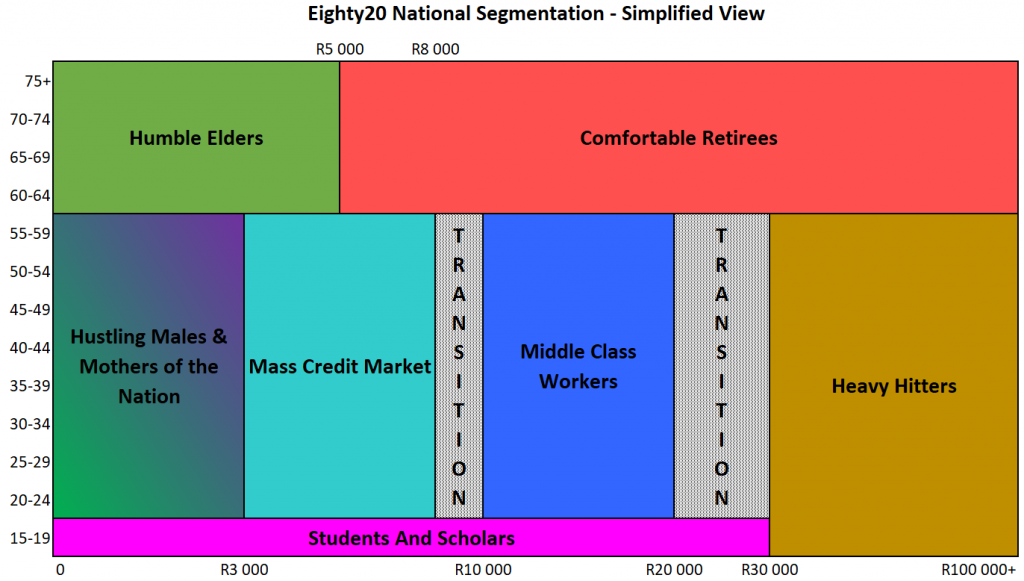
The plot below shows a simplified view of the ENS segments we saw in the previous scatter plot, plotted by age and income. This view brings out the surprisingly clear differences between segments, while also showing the “transition” phases where segments overlap. This clear separation of segments is especially interesting considering that age and income were not used as input variables into our segmentation.
The ENS’s eight main segments are:

Mass Credit Market
This is the employed, lower middle class, mostly female, some 82% of whom have retail store accounts and 1/5th who have credit cards.

Humble Elders
Low income, older grant recipients (the highest average age of all segments), with very little media or credit consumption. The lost apartheid generation.

Students and Scholars
All young, with little to no income, no credit beyond retail and no assets. Sub-segments include Future Heavy Hitters, and the lost youth.

Comfortable Retirees
Older, high income credit active and asset rich ex professionals and middle class consumers.

Heavy Hitters
This is the wealthiest 5% of the population, more assets than any other segment, mostly male, high internet penetration and lots of shopping. Their current debt load is more than 7 times that of the Middle Class Workers segment.

Mothers of the Nation
Low income, female grant recipients, mainly unemployed or underemployed. These are the domestic workers and clerks of our country.

Hustling Males
Mostly male, average age 34, low income, very little credit (not even retail credit) and high unemployment. Although fed the promise of the new South Africa, this has not been realised due to poor schooling, skills or training.

Middle Class Workers
The 3.5m middle income, credit active population with families, mortgages and shopping.
Read Part 1: Merging Consumer Datasets or Part 3: Creating Location Profiles of our blog series on how we built the ENS Consumer Profiling Tool and Segmentation


