Triangulation and common sense: How to ensure you are getting the best out of the available data
Research is an indication, not an absolute truth
While South African researchers will delight in the number of new datasets entering the market in 2023, it does pose some challenges. More data doesn’t necessarily make a researcher’s job easier. A case in point is the four datasets recently made available – MAPS, READ, ROOTS and FinScope. They all ask questions about who you bank with, yet each survey shows a different number. And that is just the banking data, there is also grocery, media and numerous other metrics.
The complexity of survey design and processing means that there are several stages during the process where not only differences, but actual errors can be introduced, creating a less than accurate representation of reality. Some are small, percentage point differences – which one would expect from different surveys, done at different times of the year with different methodologies. But other differences are so great they render certain data points unusable.
The most stark examples of that involve questions that people do not want to answer, or do not respond to accurately, such as the question: “do you have a short term / unsecured loan?”. Most people are unwilling to disclose that they need a loan to make ends meet, so do not admit to having one. When you compare short term loan claimed usage in secondary surveys with Credit Bureau data, the numbers are sometimes out by a factor of 10. For this reason, Eighty20 includes the Credit Bureau data on our data portal so that researchers could get useful data on this important issue.
The important thing to remember is that every dataset will have its issues (even the big data your BI analyst is pulling from your ERP system), and in the current age, where the quality of research is deteriorating due to dropping budgets, and potentially biased research techniques such as gathering data online, the greatest skill a research analyst can learn and bring to their analysis, is to understand the limitations of each dataset they are using, and mitigate their effects.
With data, a healthy dose of scepticism is always a good thing to bring to your analysis
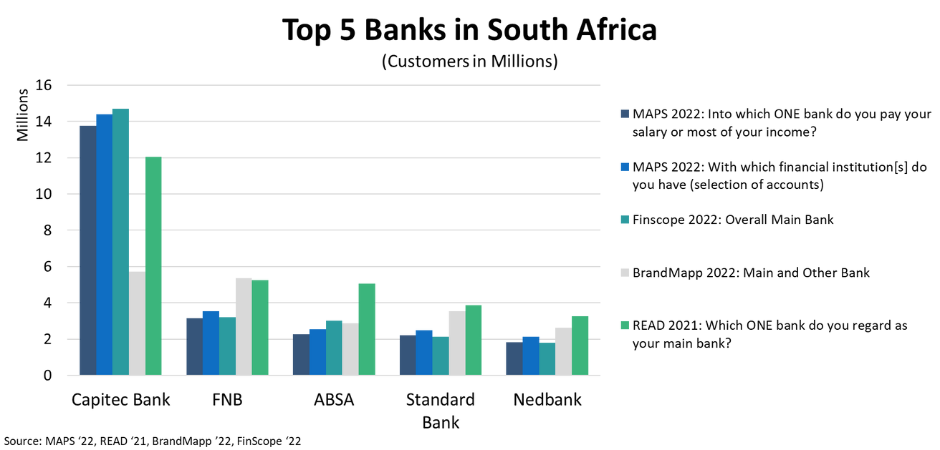
Let’s unpack further the banking data of the various surveys mentioned above. The READ, MAPS and FinScope data are within small percentage point differences on some demographics, but when it gets to the questions around banking while the order is the same (Capitec, FNB, ABSA, Standard Bank and Nedbank) the differences in numbers are noticeable. Note that BrandMapp uses an online panel of people earning more than R10,000 per month.
So, what must an analyst do? The process of using several data points to understand a market is called Triangulation. This process involves some common sense and a bit of work on the part of the analyst to determine how to proceed.
To unpack this in a bit more detail, below are several helpful questions you can use when assessing different research datasets:
1. Who gathered the data?
Was it a reputable company using best practices? At Eighty20, we send out a fact every day to thousands of subscribers. (You can see the thousands of facts and sign up here.) Each week has a theme, and often, when the topic is something like Valentine’s Day, we scour the internet for interesting facts. What we find is all sorts of entities from flower delivery companies to condom manufacturers have put out some form of online survey to a handful of participants, but because of SEO and online algorithms these findings come up high on the search ranking and look like professional research. Ensure that you use data collected from reputable sources with a track record of using robust research methodologies.
2. What was the purpose of the study?
Was it a small dipstick research sample or a nationally representative survey? Also, was there any bias in collecting the data, for example a customer satisfaction study that asks, “are you extremely satisfied, very satisfied, somewhat satisfied, satisfied, or not satisfied?” A radio station poll asking your favourite song, will give some interesting information, but cannot be used to rank the most popular songs of the year.
3. How was the information collected?
Was it a face-to-face nationally representative study, a mixed methodology online and face-to-face, or an opt-in purely online survey? What were the methodologies and sample sizes of the different studies? Sample size in the surveys discussed ranges from 5,604 in FinScope, to 14,730 in READ, 20,000 in MAPS, and 32,000 in BrandMapp. The first three are nationally representative surveys that weight their samples to the adult population of South Africa, so you can get an idea of the market size for a brand or product. As most surveys undercount in wealthier areas, an online survey like BrandMapp focusing on this segment is very helpful. However,it significantly underrepresents Captitec’s numbers because it is not surveying low-income customers.
A number of online surveys were started by purchasing an existing customer list and so may include any bias that was present in the original sample.
4. What information was collected and how was the question worded?
Small changes in the question can have a dramatic impact on the results. In the banking data discussed, the questions are “Into which ONE bank do you pay your salary or most of your income?” (MAPS), “Which ONE bank do you regard as your main bank?” (READ), “With which financial institution[s] do you have … (an account)” (MAPS), and “Overall Main Bank” (Finscope). The question: “At which ONE food and grocery store do you estimate that you spend MOST money?” will result in a massively different answer set than “Which shop/s you usually do your BULK shopping?”
| ❝ |
Sometimes questions sound similar but are in reality quite different and can cause respondent confusion |
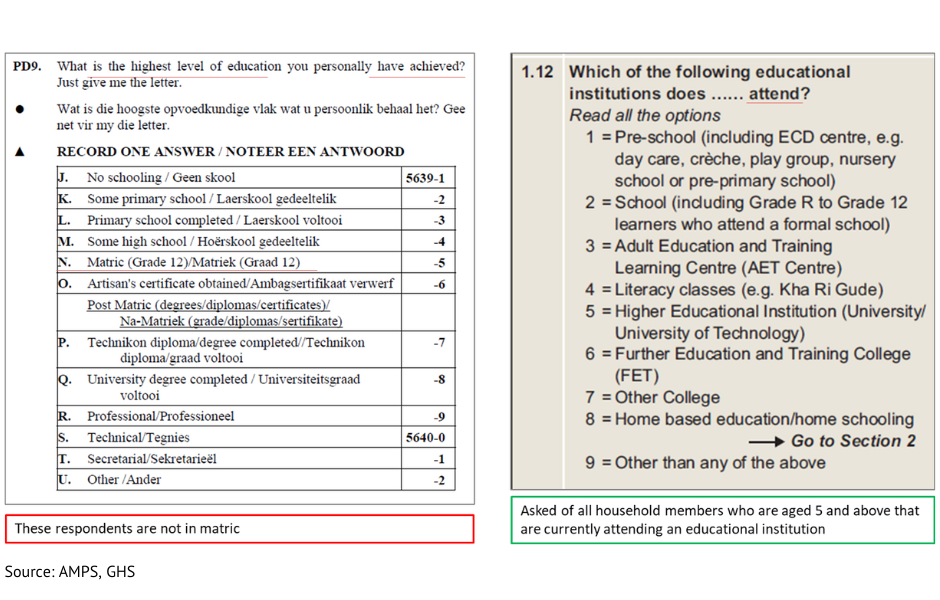
Below is an example of the difference between “Which of the following educational institutions do you attend” versus “What is your highest level of education achieved?” These questions give vastly different numbers as one is giving overall levels of eduction while the other is only looking at current learners. 5. What are the ways the respondent may answer the question?
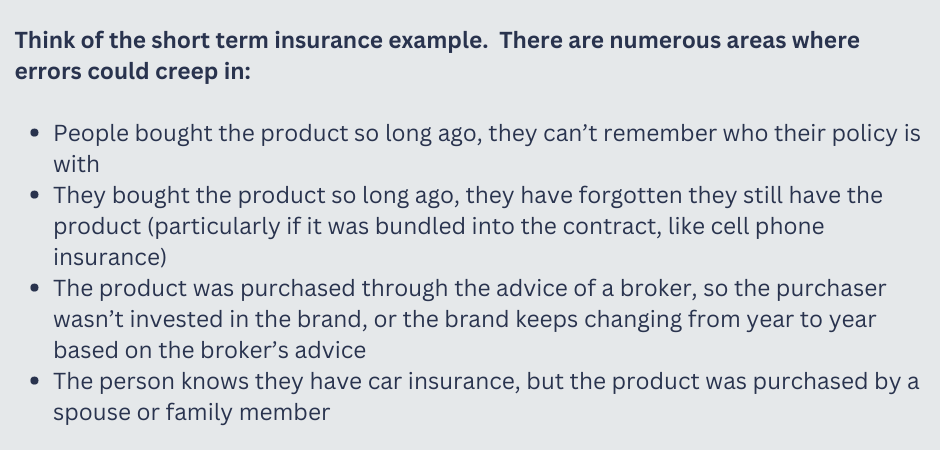
What one also has to remember, and clients never like to hear this, in the customer’s mind your brand might be no more than a fleeting thought in a busy, chaotic shopping trip. When answering surveys, do you remember the last brand of Whiskey you drank, or are you thinking of your preferred brand? Did you sign up for Pick n Pay’s SmartShopper programme so many years ago that you’ve forgotten about it or are you using your husband’s card?
6. When was the information collected?
The past few years have been quite tumultuous; survey data from 2019 could be dramatically different from data from 2020 when we experienced months of lock down and were limited in how and where we could shop. In the banking example above, the READ banking data is imputed from 2019 survey data, whereas the MAPS, BrandMapp and FinScope data was gathered in 2022. There might even be seasonal impacts during the year. Everyone has less money in January than at other times of the year, and as such will answer questions on finances and shopping differently.
7. Is the information consistent with other information?
When compared with similarly conducted surveys or other sources of information, is the information consistent and reasonable? This is the key issue with triangulation, and the comparison has to go beyond secondary datasets. Are you comparing the vehicle questions in MAPS with The National Association of Automobile Manufacturers of SA new vehicle data? Are you looking at banking company annual reports, analyst reports or even reputable news articles to triangulate your numbers? Are you comparing the survey reported numbers on internet connectivity with World Wide Worx and other internet and digital studies? Are you comparing the insurance numbers with information released by the Financial Services Board?
It is important to remember that mining a secondary database, no matter how good it may be, is only one part of your job as a researcher. Don’t let go of your common sense, and always approach each statistic or database with a healthy dose of scepticism.

